Building a modern fleet management platform
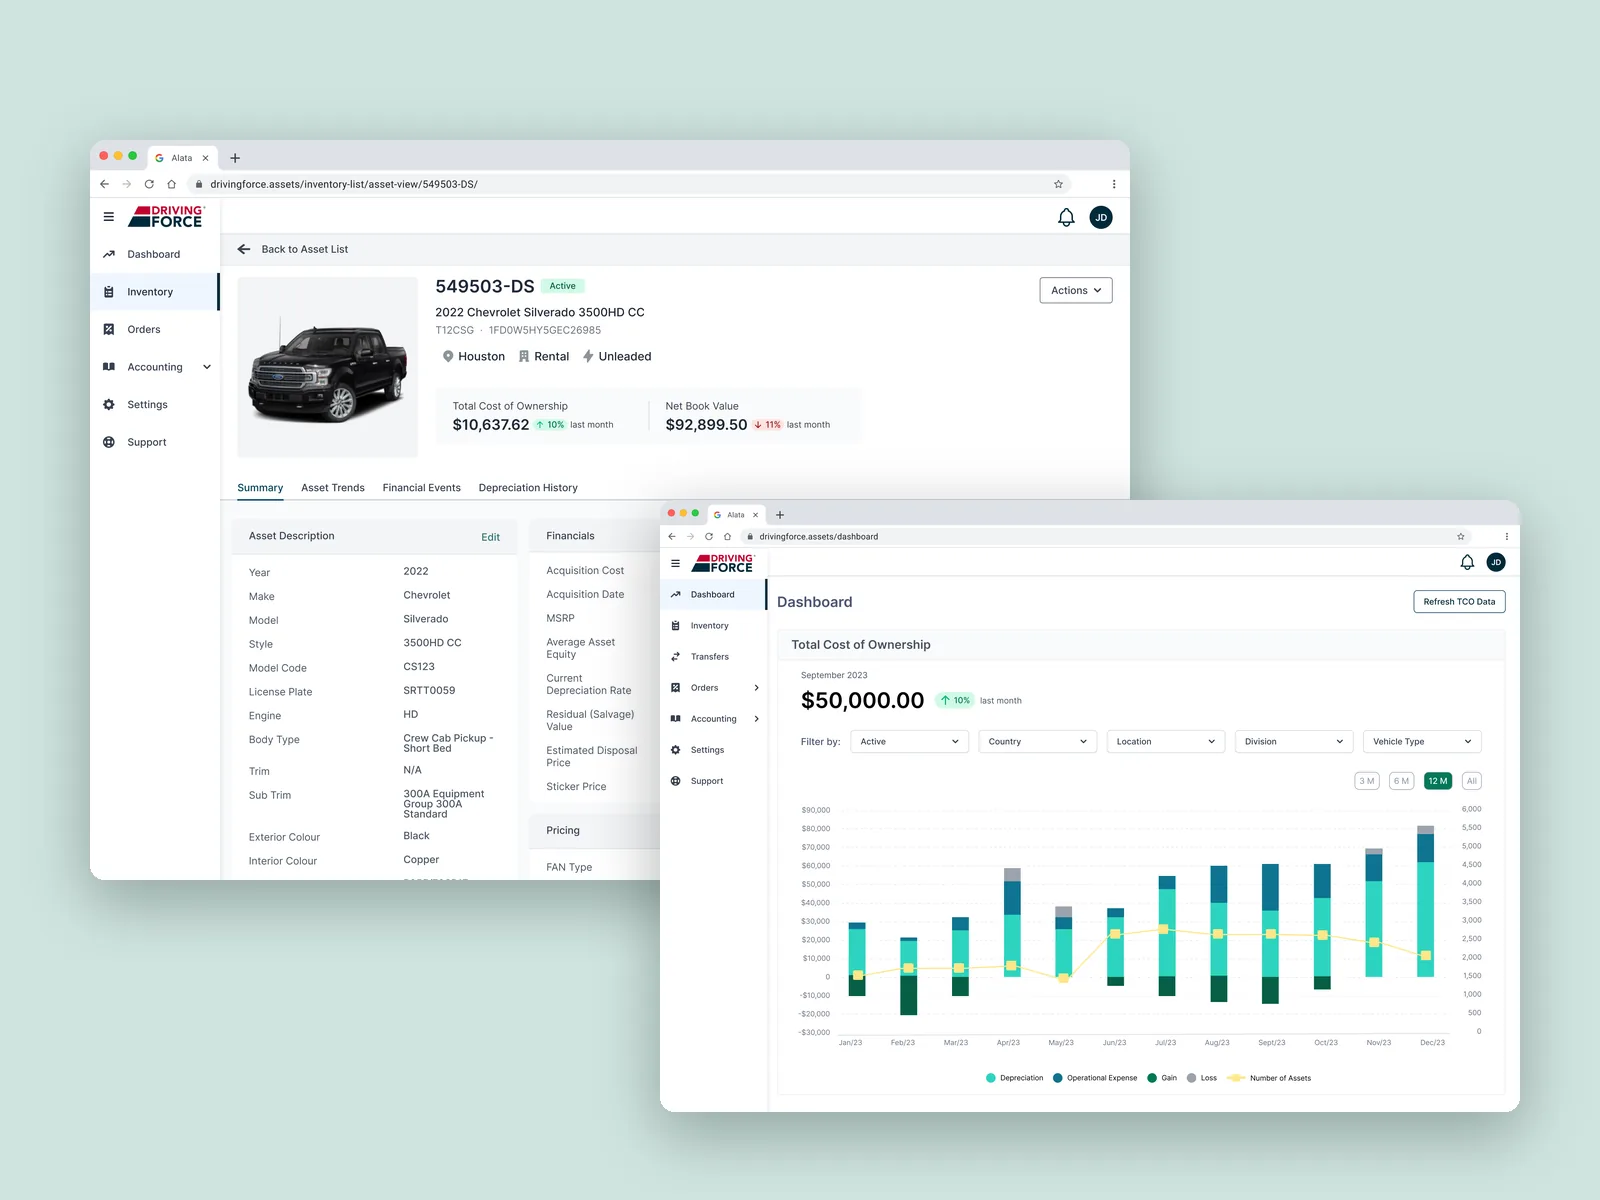
Driving Force ran its fleet on a proprietary legacy system, propped up by Excel, paper and notebooks. With Versett, I helped design its replacement from proof of concept to MVP: one platform for the operations, accounting and sales teams who keep a fleet running.
- The tension
- Every team worked around the legacy system in its own way, so no one had a single, trustworthy view of the fleet.
- The turn
- A proof of concept proved the value of putting it all in one place. Months into the MVP, a misread of the requirements forced a reset, and a sharper scope.
- Where it landed
- A platform covering fleet ordering, accounting and day-to-day operations, with 300+ users at launch.
Problem
A legacy system everyone worked around
Driving Force's proprietary fleet software couldn't keep up with how the business actually ran. Teams across the company depended on outside tools to fill the gaps.
With no single source of truth, every decision about the fleet started with collecting information from somewhere else.
Research
Seeing the work up close
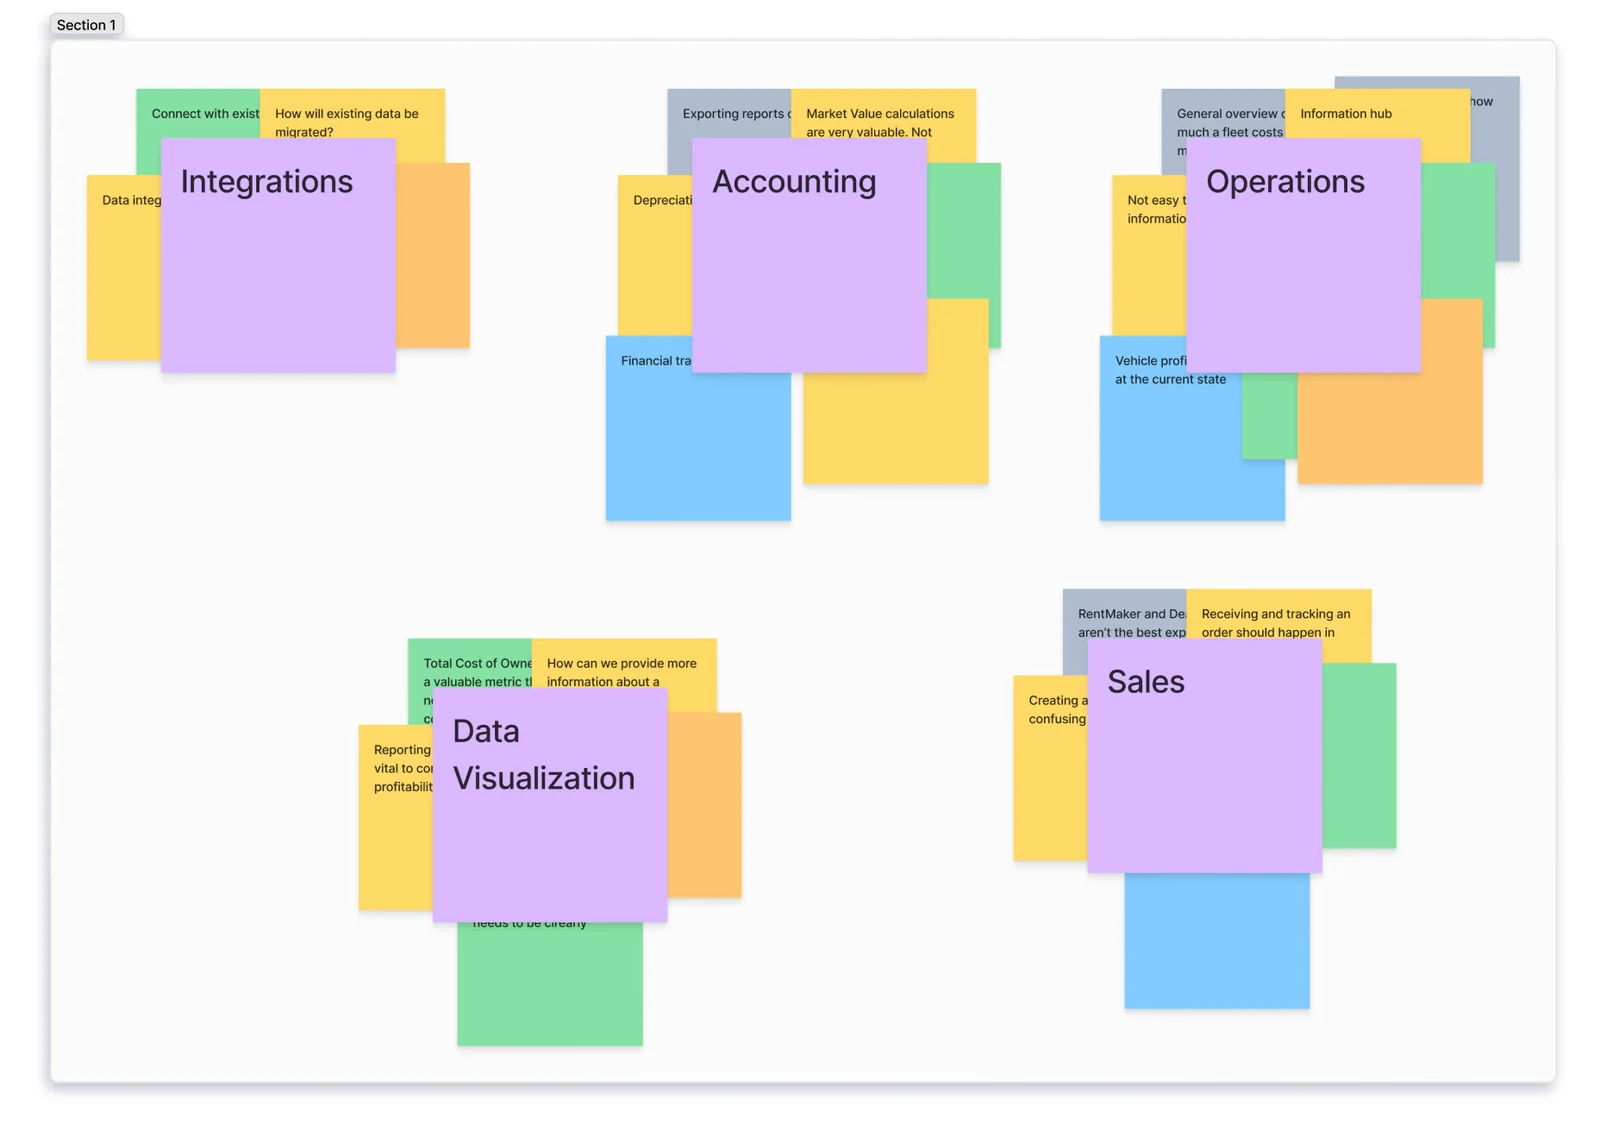
We interviewed 11 people across roles (fleet managers, operations managers, accounting directors and sales managers) and observed 4 of them in their working environments.
Exploration
Prove it first, then build it
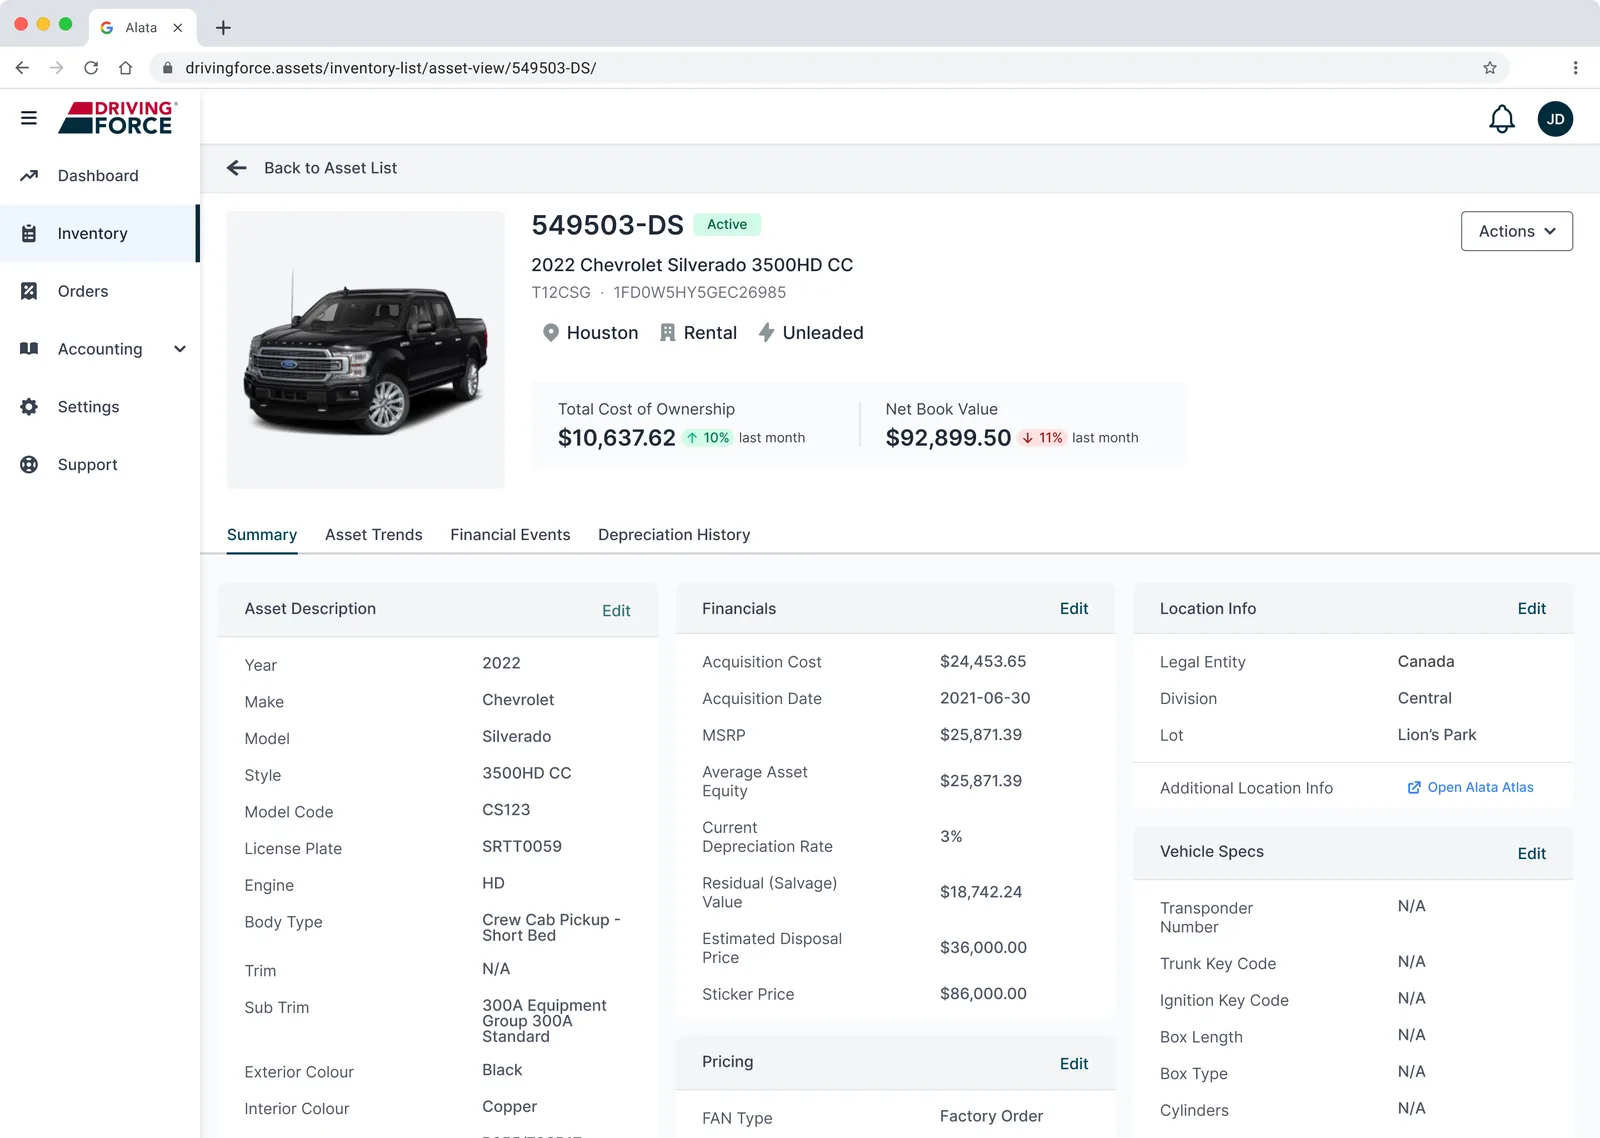
We started with a proof of concept to validate the idea with Driving Force's decision makers. It focused on two things: an asset inventory with visibility across the whole fleet, and an asset detail view showing financial history, vehicle specs and key metrics like Net Book Value and Total Cost of Ownership.
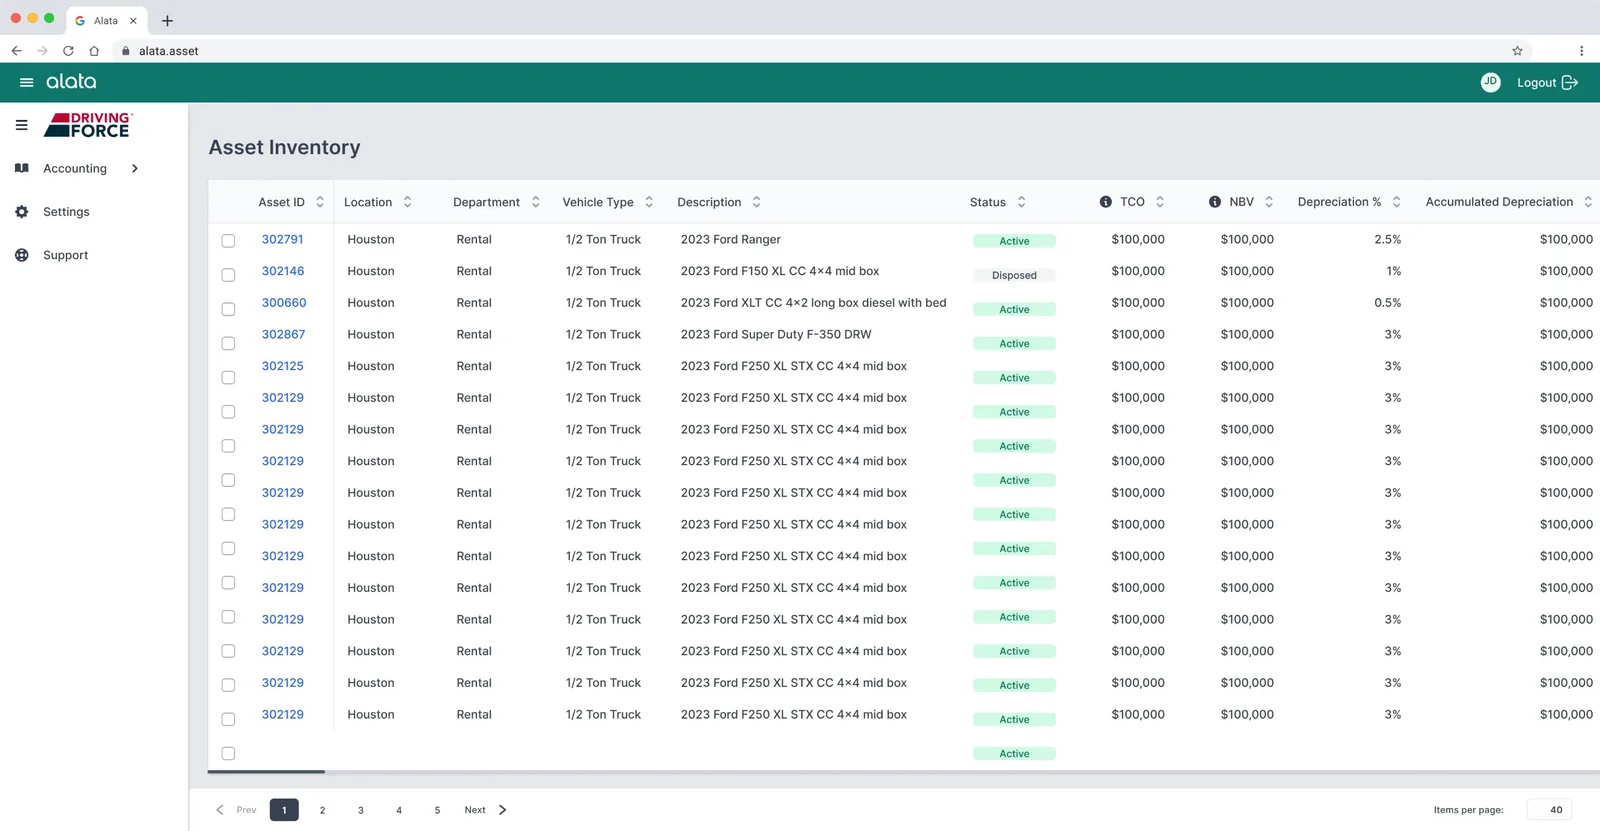
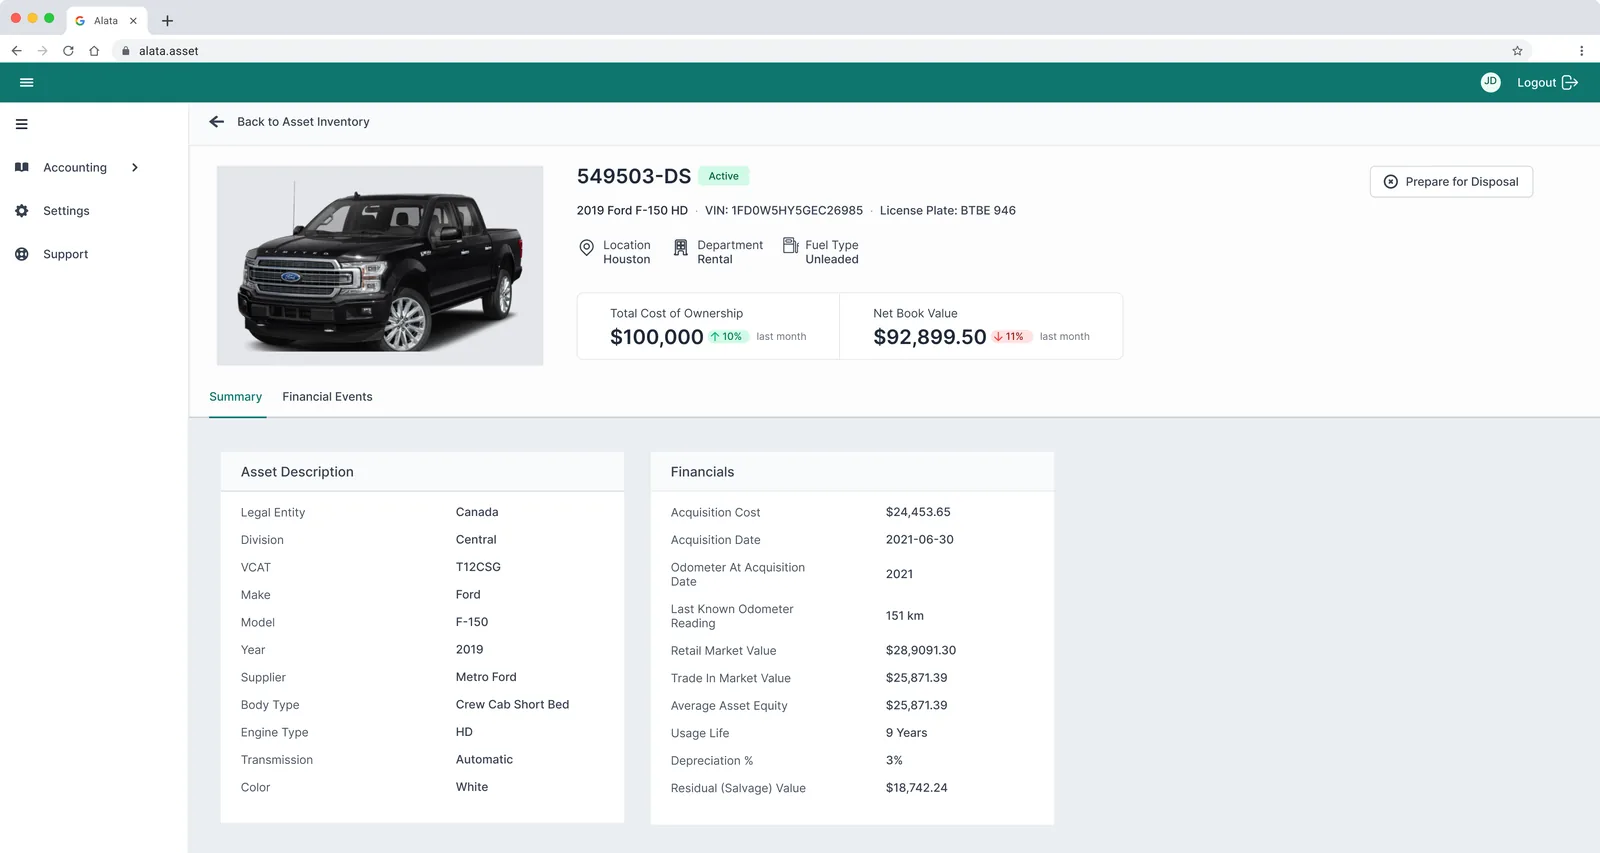
We tested it with Driving Force's internal team and external fleet managers. What resonated most was how much it brought into one place, replacing a tool stack they'd been working around for years. The proof of concept was greenlit, and the MVP set out to cover operations, accounting and sales.
Building the wrong thing, and resetting
Requirements reached us through the client's business analyst, who was our source of truth. A few months into the build, the Product Owner called out in a presentation that we'd been designing around the wrong use cases and assumptions. It created real tension: the client felt we were off track from what they expected.
We put a plan in place so that every requirement passed between teams was verified before we designed against it, and we scaled the MVP back to the use cases that mattered most: vehicle configuration and ordering, and accounting work like forecasting and tracking Total Cost of Ownership.
Solution
One platform for the whole fleet
The MVP was guided by three principles:
Dashboard
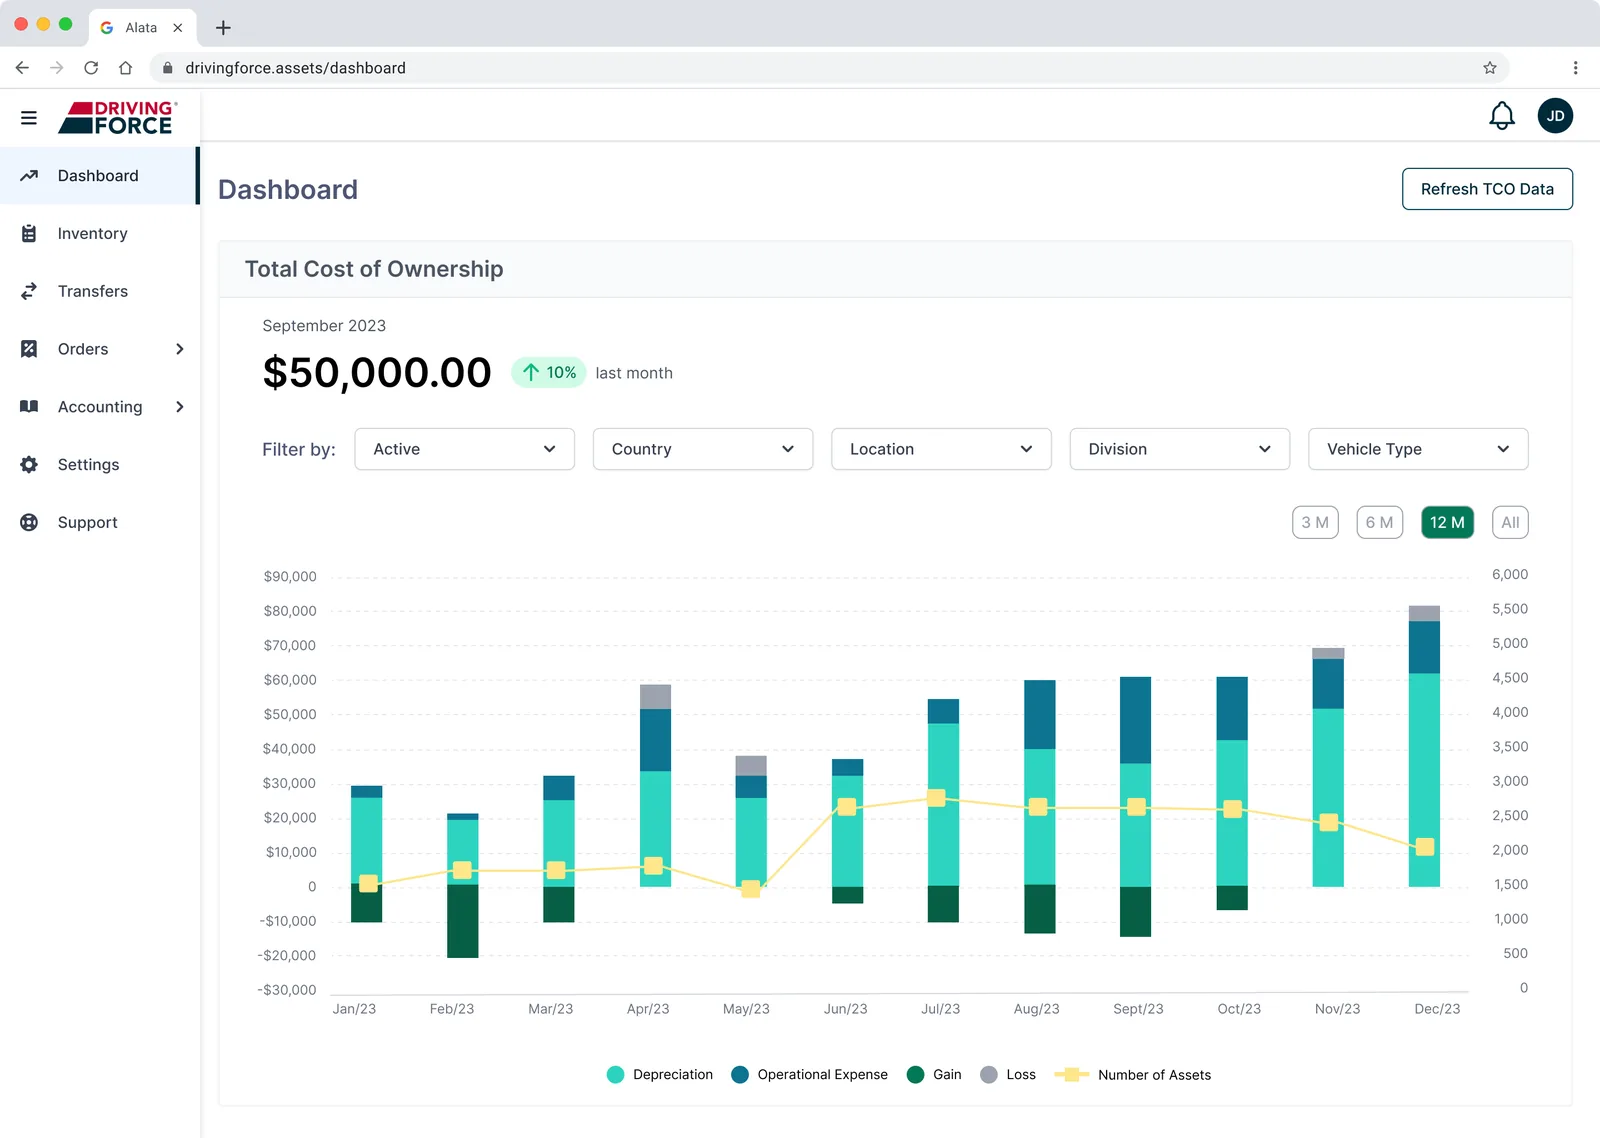
A bird's-eye view of Total Cost of Ownership, filterable by location, division and vehicle type, so fleet managers could check the health of the whole fleet without opening a spreadsheet.
Vehicle profile
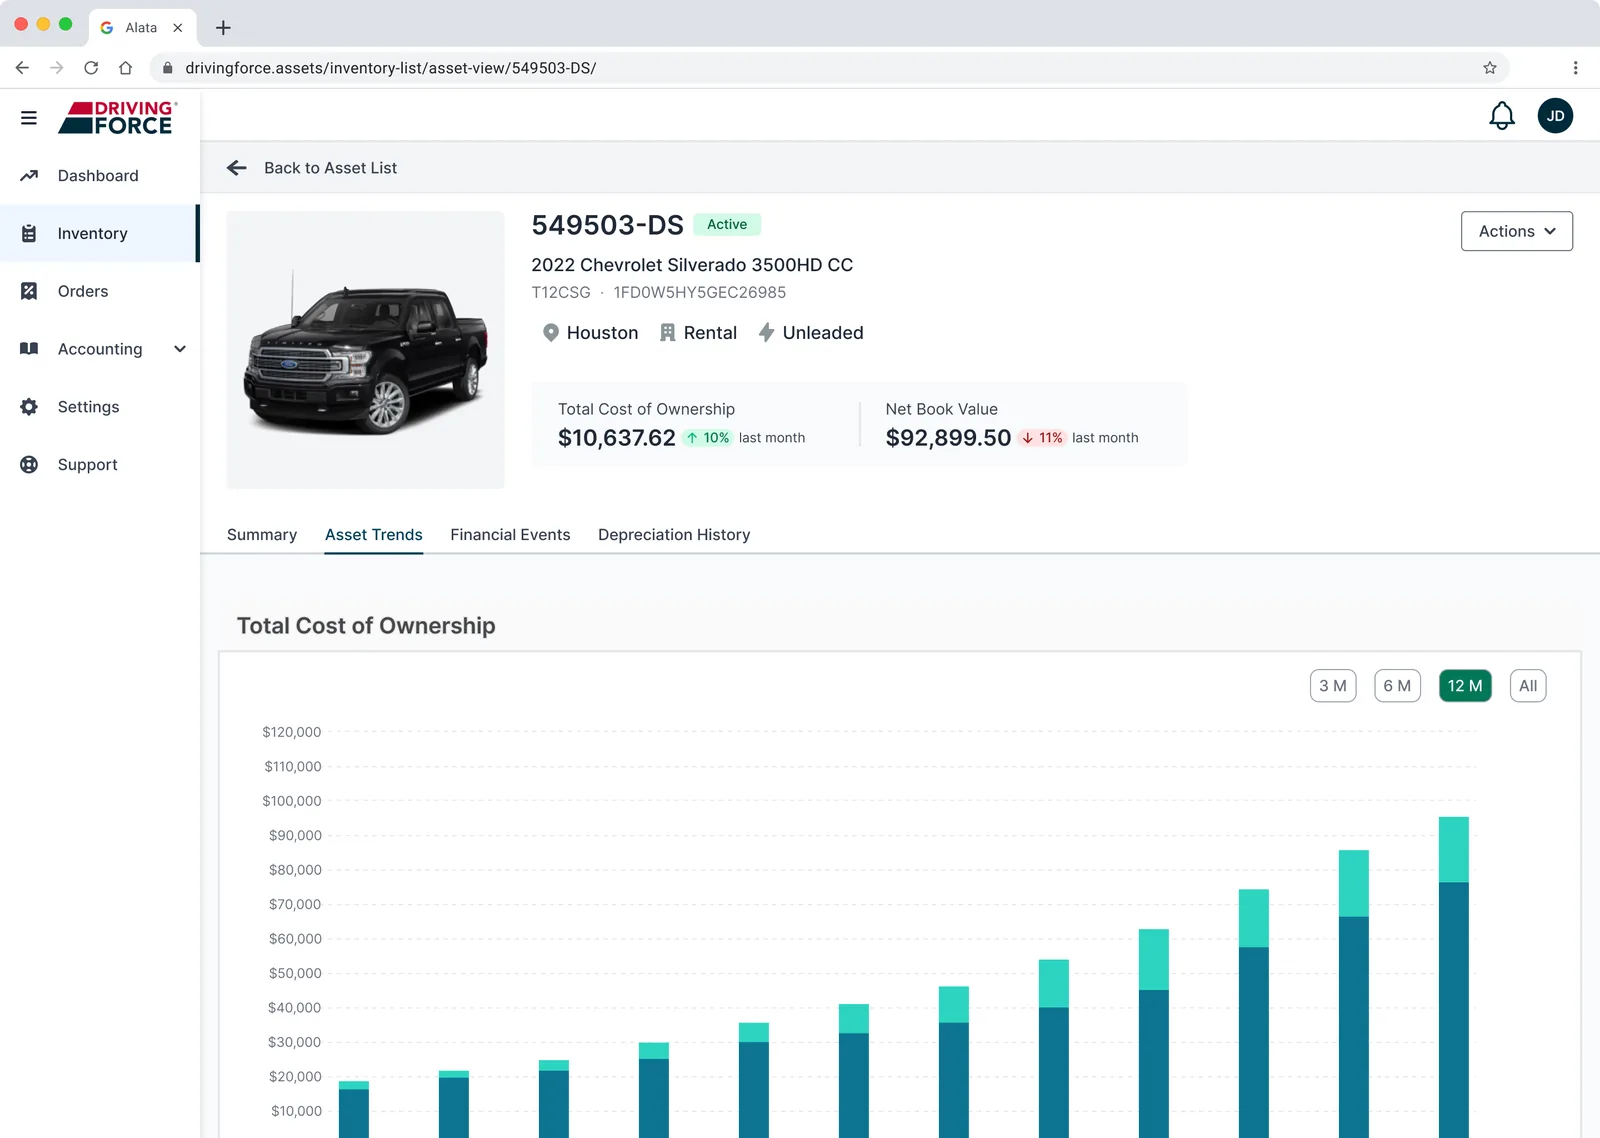
Expanded from the proof of concept to serve accounting, sales and operations in one place. Summary, Asset Trends, Financial Events and Depreciation History give each team its own layer of data.
Inventory
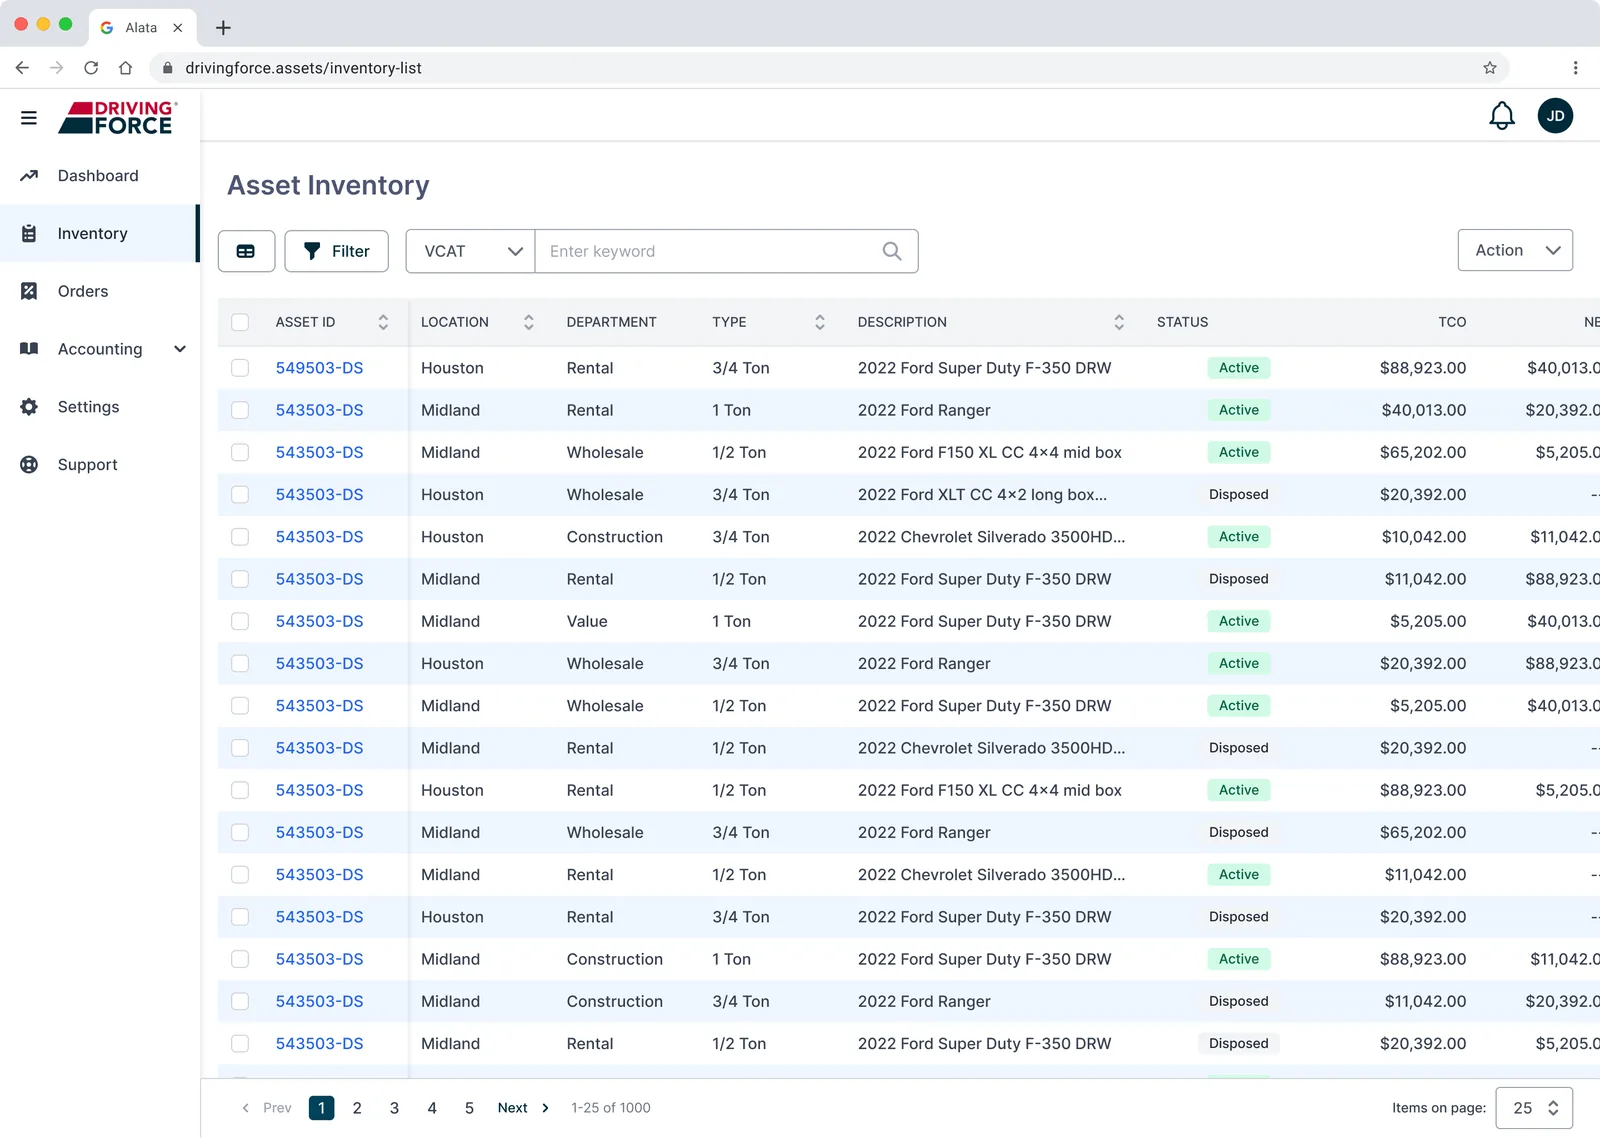
Dynamic filtering, search, customizable table views and bulk actions replaced the proof of concept's static list.
Accounting
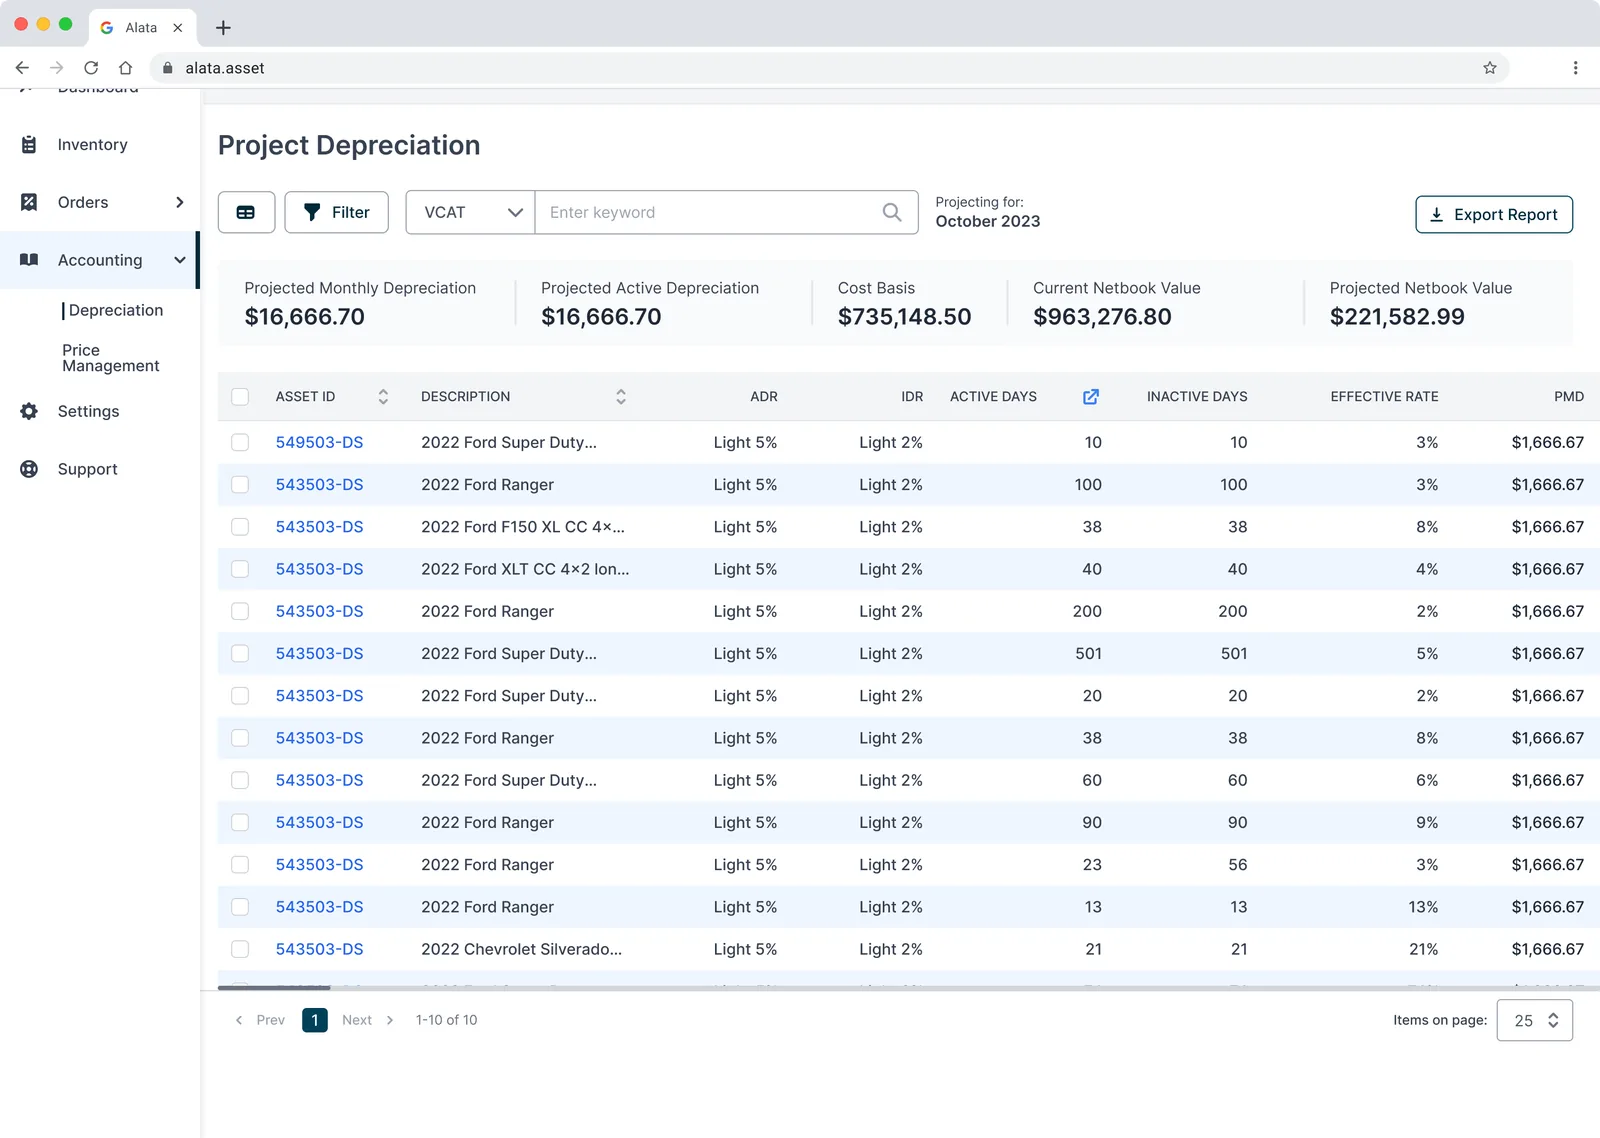
Projection reports, depreciation tracking and a GP integration meant accountants no longer reconciled data across systems by hand.
Vehicle ordering
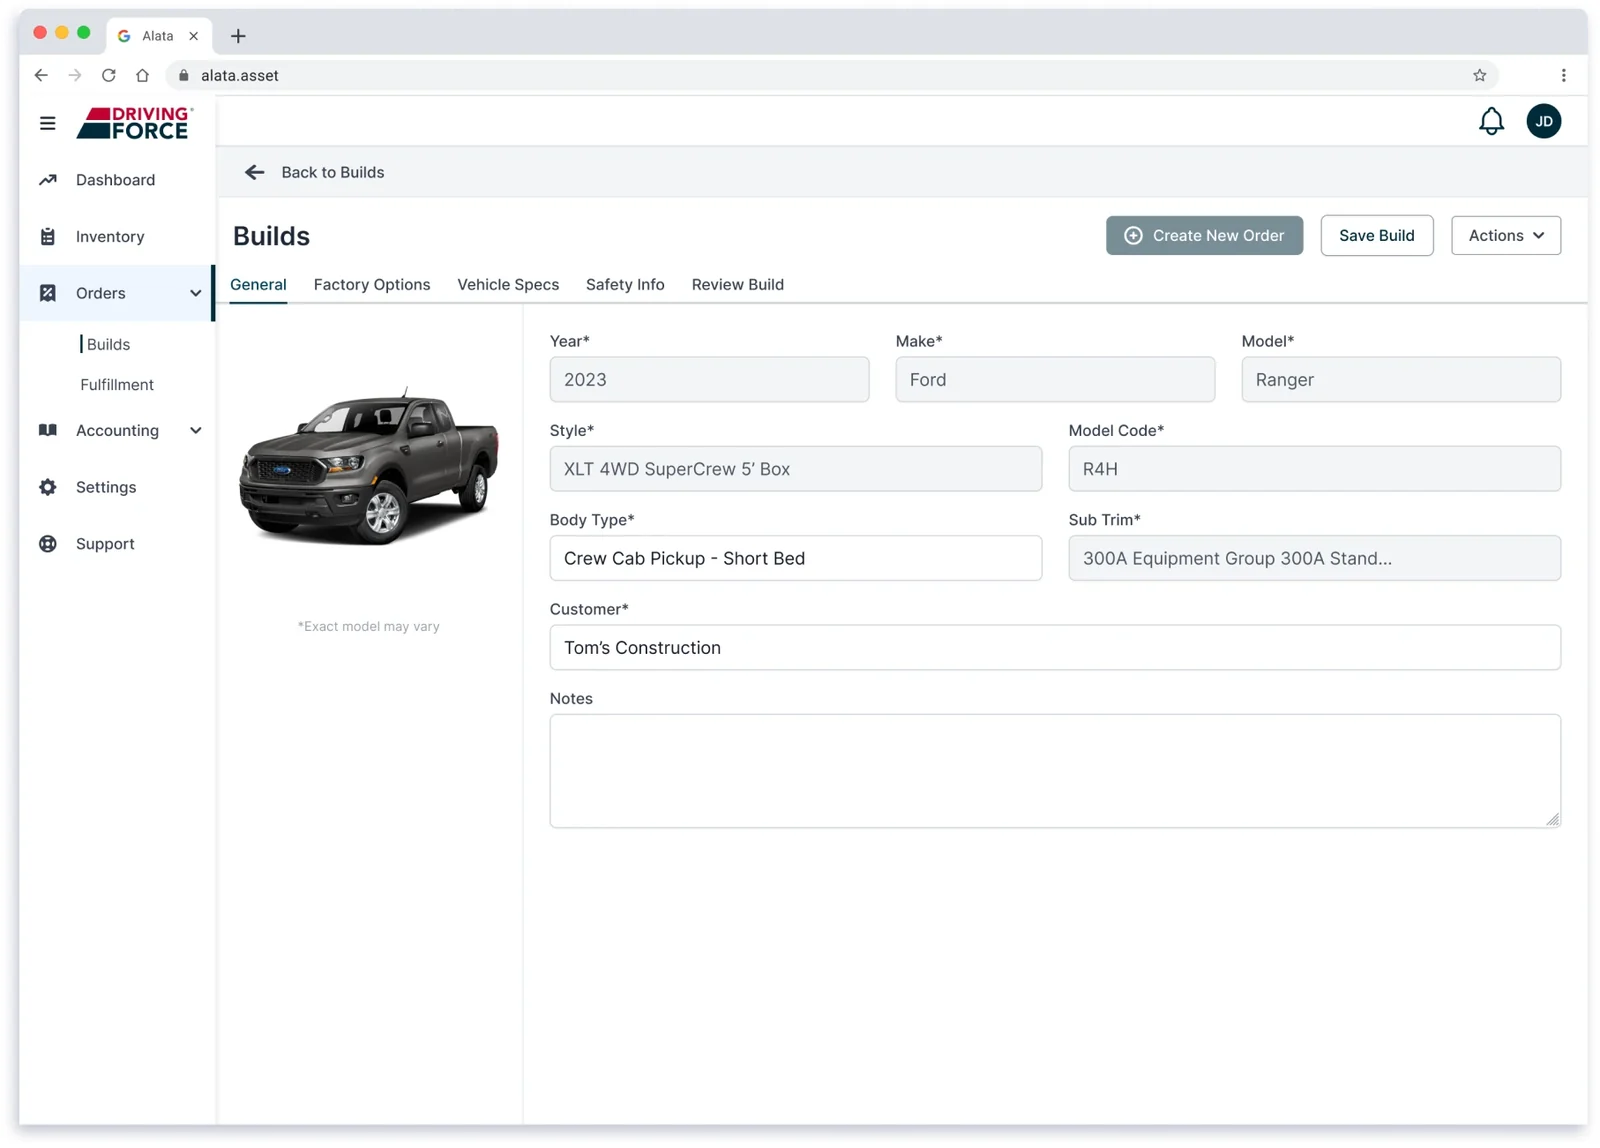
A ChromeData integration filled in vehicle specs, upgrades and safety ratings that salespeople used to look up themselves. "Save a build" let them reorder without starting over.
Impact
A platform people wanted to use
What this product can do is way beyond what I could've dreamt of.Justin K., Accounting Director, Driving Force
The platform launched with 300+ active users. After launch, the team reported average maintenance savings of $25k a month, and $130M in business running on the new platform. I'd moved on from Versett by launch, so these figures come from colleagues who saw the project through.
Reflection
Where my systems thinking started
This was my first large SaaS project. Coming from marketing sites focused on conversion, I learned to design for whole workflows instead of polished screens, and to understand both how users think about their work and how the system behind it is built. It changed how I approach every project since.
It also taught me how much a client relationship depends on accurate communication. The requirements reset could have been caught earlier with the verification we put in place afterwards. And I'd push for a more realistic timeline: twelve months for a platform this broad was ambitious.